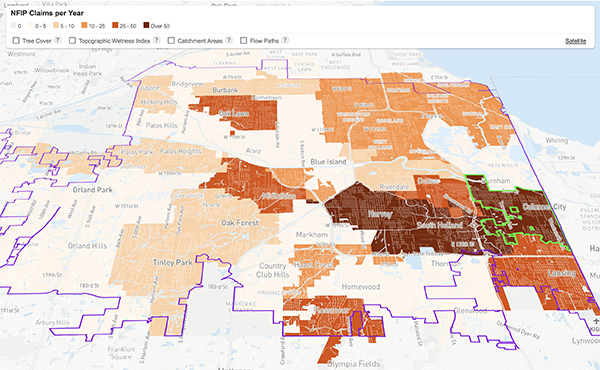
The Village of Calumet Park
Calumet Region of Cook County, IL
The maps, numbers, and information below provide a clearer picture of where, why, and who urban flooding has impacted in this community.
Scroll down to begin exploring
by CNT
Where is it flooding?
Mapping where it floods in Calumet Park
Urban flooding can occur outdoors and indoors, in both public areas (streets, parking lots, parks, etc.) and private spaces (backyards, basements, etc.). For this project, CNT primarily maps flooding instances found outdoors and in public areas. Urban flooding is more likely to occur in areas that are lower-lying or depressed; in places with more impermeable surfaces (like sidewalks, streets, and parking lots) where water cannot be absorbed or soaked up by plants and soil; and in communities with older sewer systems that cannot handle the amount of rainwater or snow melt entering the system.
To understand where flooding has occurred from past storm events and where flooding is projected to happen in the future, CNT uses three categories of data. They are community-identified problem areas, maps that show flood risk, and insurance claims from the federal government and private companies.
Where it Floods
Problem Areas
Two ways to understand where community-wide flooding occurs are stormwater photos collected after rain events and community-identified problem areas (when available).
See where problem areas have been identified:
Note: Problem area data was collected only for the 2016 RainReady Calumet Corridor Plan in Blue Island, Calumet City, Calumet Park, Dolton, Riverdale, and Robbins.
*Survey locations are mapped to the nearest intersection.
Community-identified problem areas are gathered through community meetings, municipal studies and staff insights, and surveys. These locally identified flooding concerns are critical to uncovering instances of flooding that other data (like risk-based maps or insurance claims, shown later) may not reveal.
From March 2021 to May 2022, in coordination with this project, residents collected photos of areas flooded during recent storms in Dixmoor, Dolton, Harvey, Markham, Phoenix, Posen, and Riverdale. These photos can be viewed on the Stormwater Photos page.
In communities that do not have wide-spread, updated community-identified flooding areas or photo data available, local advocates can work with their elected officials and municipal staff to collect data and make it accessible. These data can be used to gain insights into where flooding happens.
Where it Floods
Risk-based Flood Maps
FEMA Flood Zone Designations
- A
- AE
- X
Another way to understand where flooding may occur is to reference federal studies and maps that establish and visualize flood risk. The U.S. Federal Emergency Management Agency (FEMA) determines flood risk within a community and visualizes this flood risk via its Flood Insurance Rate Map (FIRM). This map is used by the National Flood Insurance Program (NFIP) to define flood hazard areas and flood zones within a community. Different levels of flood risk in an area— low, moderate, or high— are assigned their own combination of letters called a flood zone designation. Flood risk on the FIRM maps are generally calculated based on riverine or coastal flooding risks. A property’s location within a flood zone determines if the property is required to take on flood insurance. Homeowners whose properties are outside of a flood zone are not required to purchase insurance through NFIP but may do so voluntarily.
According to FEMA’s analysis, a home is at high-risk of flooding if there is a 1 in 4 chance of flooding over the course of its 30-year mortgage.1
« Problem AreasOther Risk-based Flood Maps »
1 US Department of Homeland Security. (2021, November 10). Flood Maps. FEMA. https://www.fema.gov/flood-maps
Other Risk-Based Flood Maps
Chicago Metropolitan Agency for Planning (CMAP), the planning agency for northeastern Illinois, developed a Flood Susceptibility Index (FSI) in 2018. The FSI helps prioritize which areas need stormwater management solutions throughout the region. Similar to CNT’s tool, the FSI looks at depression areas, combined sewer service areas, impermeable cover, elevation differences, and age of first development which impacts how buildings were built for potential floods. Their resource, however, does not include any community-identified data or resident-collected photos.
First Street Foundation, a nonprofit working to increase awareness of climate change-related fire and flood impacts, developed FloodFactorTM at-risk properties, a tool that shares flood risk for each home. FloodFactorTM assigns both the likelihood and severity of flooding over a 30-year period. The higher the percentage, the more likely a property is to experience flooding. Note: FloodFactor™ does not calculate real-time flooding incidents, only the risk for these incidents.
Where it Floods
Flood Insurance
Flood insurance provides financial support to the insured person in the event of property loss or damage due to a flooding incident (as defined by the flood insurance provider). Mapping the frequency of flood insurance claims helps show where home flooding has occurred.
At the federal level, flood insurance is available through the Federal Emergency Management Agency’s (FEMA) National Flood Insurance Program (NFIP). Homes in the federally drawn floodplain are required to purchase NFIP flood insurance.
In the case of severe storm events, the federal government can make a disaster declaration for a state or region, which makes a separate pot of funds, called Disaster Relief funds, available to impacted homeowners and renters through FEMA. Homeowners and renters do not need to carry insurance to make a claim and receive Disaster Relief funds.
Private insurance companies also offer flood insurance coverage, generally as a rider on a home or rental policy.
Flood insurance claims are made only after a flooding incident occurs and only if the homeowner or renter has a current flood insurance policy or there is an applicable disaster declaration.
Homes outside of the federally drawn floodplain are not required to carry any flood insurance (federal or private). Some homeowners involuntarily choose not to purchase flood insurance either because they aren’t aware of it as a resource, are unable to afford it, or they perceive their flood risk as low or non-existent.
If a home floods and is not covered by any form of insurance and there is no applicable declared disaster, their incident is not reflected in the claim count or on this map.
Where it Floods
Flood Insurance: Comparison Charts
Quick Facts
- From 2010 to 2020, the Village of Calumet Park had total claims (NFIP claims and Disaster claims) per 10,000 residents with an average payout of $ per claim.
- The Calumet Region has 556 total insurance claims per 10,000 residents, which is larger than Cook County’s numbers which is 300 insurance claims per 10,000 residents. This measurement is used to better compare insurance claims between the Calumet Region and Cook County. If the above bar graph used the total number of insurance claims, it would show Cook County has more because the Calumet Region is within Cook County and has fewer people than Cook County. However, in order to compare the two areas apples to apples, the chart evens out the differences in population size by finding a rate of insurance claims per 10,000 people. The above chart indicates that insurance claims are filed more frequently per person in the Calumet Region than in Cook County overall, which suggests that flooding impacts Calumet Region residents more frequently.
Summary: Where it Floods
Data limitations prevent knowing precisely where it floods in Calumet Park.
Urban flooding can happen anywhere, and it often occurs without a single identifiable cause. Floods do not restrict themselves to a single backyard, street, or municipal boundary. The information revealed in the “Where Is It Flooding?” section does not capture the full picture of where flooding has occurred in Calumet Park and where it may occur in the future. For instance, flood risk mapping, while a good way to understand where and how severely it might flood in an area, cannot predict every flood before it happens, and local conditions (sewer system capacity, development changes, etc.) are frequently changing. Further, NFIP and private insurance claims do not show the total number of real-time flood events on private property because not everyone has flood insurance.
Conversations with residents and municipal staff about where and when flooding has occurred are necessary to accurately understand the extent of flooding in public and private spaces of a community. Local governments can improve federal datasets, like FIRM, by participating in FEMA’s NFIP program and sharing local knowledge on flooding.2
Improving local data collection in coordination with federal datasets is an important step to reducing the financial and social burden communities feel in the aftermath of flooding events.
« Flood Insurance ChartWhy is it flooding? »
2 US Department of Homeland Security. (2021, November 10). Flood Maps. FEMA. https://www.fema.gov/flood-maps
Why is it flooding?
Mapping what contributes to flooding in Calumet Park.
Urban flooding happens in the Calumet Region for a variety of reasons at interplay with each other. Historically, glaciers flattened the region creating low-lying areas and depressions, causing rainfall to stay and pool rather than run off. Flooding also results from deliberate societal choices made over time. The development and widespread use of impermeable surfaces like asphalt and concrete pavement act as solid barriers that stop rain from filtering into the soil. The use of fossil fuels has generated intense climate change-driven storms and changing temperatures, resulting in more intense rainfall. Sewer systems across the country are decades old and were designed to accommodate less rainfall and sewage from fewer households. Given increasing population density, more intense rainfall, and development patterns that drive an increase in impermeable surfaces, sewer infrastructure frequently lacks the capacity to sufficiently manage stormwater during moderate and heavy rain events.
To understand what contributes to flooding in Calumet Park, CNT analyzes the permeable and impermeable land cover of the area, Calumet Park’s land use, the community’s topography and how it influences the way water flows over land, and the type of sewer system serving Calumet Park. These data, explained and visualized next, introduce why urban flooding may occur in Calumet Park.
Why it floods
Impermeable and
Permeable Surfaces
Mapping land cover in Calumet Park
Land Cover
- Permeable
- Tree Cover
- Grass, Shrub
- Bare Soil
- Impermeable
- Buildings
- Roads, Railroads
- Other Paved Surfaces
Solid, human-made surfaces like streets, parking lots, and buildings prevent rain from soaking into the soil. These surfaces are impermeable, meaning they do not allow water to absorb in or pass through them. Typically, the more development (commercial, industrial, residential, etc.) a municipality has, the more impermeable land cover it will have. When rain hits these surfaces, it either runs off into the sewer system (if the system has the capacity) or pools on sidewalks, parking lots, and sometimes even yards.
Note, that while some roadways and sidewalks are made from permeable pavement rather than traditional concrete, permeable materials are not widely used for high-traffic roadways.
The earth naturally absorbs stormwater. While impermeable surfaces disrupt this process, permeable surfaces like bare soil, turf, trees, and other natural spaces act as automatic water absorbers. There are many benefits to natural spaces, including their intrinsic stormwater management processes. However, the type of permeable surface affects how effectively water can infiltrate it. For instance, grass, while a permeable surface, has shallow roots that don’t absorb water as well as deep-rooted native prairie plants.
Why it floods
Land Cover Distribution Chart
The amount of land covered by trees is called tree cover. Trees have an important role in flood prevention through their role in the water cycle. They absorb and retain water with their roots, hold onto water with their leaf canopies, and release water back into the atmosphere through a process called transpiration. All of this helps keep water out of streets, sewer systems, and homes. Trees are best at managing flooding when they are healthy, intersect with water flow paths, and surrounded by more tree cover. Lower tree cover creates more opportunities for flooding incidents.
Quick Facts
- Trees cover 19% of Calumet Park, which is Equal to than the 19% tree cover in the Calumet Region as of 2010.
Why it floods
Land Use
Mapping land use in Calumet Park
Land Use Categories
- Residential
- Commercial
- Institutional
- Industrial
- Transportation
- Open Space
- Vacant
In municipalities, there are many different uses for land: residential, commercial, institutional, industrial, recreational, transportation, open green space, and vacant uses. Communities often designate different areas of land to separate these uses for several reasons, ranging from public health protection to economic development goals. Land use designations are often visualized on a land use map, which shows how much land is being used for which specific purpose.
Different land use categories have different impacts on how likely it is to flood and on stormwater quality. Every land use type signifies some level of impermeable land cover, which again is a solid surface like concrete, asphalt, or steel that does not absorb stormwater. However, the level of impermeable land cover in open green space land use is minimal compared to other land uses.
It is important to note the amount of industrial land use in a community and the land uses near industrial areas. Waste byproducts from manufacturing and industrial practices are a major source of air and water pollution, which can be particularly problematic if there are residential land use zones nearby. If these pollutants are already in the environment, heavy rainfall events may result in toxic stormwater runoff, which may pose serious public health hazards and exacerbate environmental contamination.
Why it floods
Land Use Distribution Chart
Quick Facts
- The largest land use type in Calumet Park is Residential.
- 8% of Calumet Park has land designated for industrial use.
- In comparison, 6% of Cook County and 7% of the Calumet Region have land designated for industrial use.
Why it floods
Depressed Land
Topographic Wetness Index
The Calumet Region, like most of the Midwest, is mostly flat, courtesy of Ice Age glaciers. Flat land slows stormwater runoff because there is little to no naturally sloping land to propel water movement. Flat land, especially impermeable land, also causes inefficient drainage because stormwater tends to collect and pool. However, few natural surfaces are perfectly flat – where lower-lying areas (or depression areas) exist, stormwater runoff will pool, creating the potential for hyperlocal flooding.
The Topographic Wetness Index is an analytical approach to understanding where water may collect and pool based on a community’s topography (or the subtle variations in land elevation). This approach assumes that the sewer system is at capacity and then looks at where water would collect and pool in that scenario. More on sewer systems next.
Quick Facts
- 20% of Calumet Park may be susceptible to urban flooding by rainfall runoffs likely caused by depressed land when sewer systems are at capacity.
Why it floods
Sewer Systems
Sewer systems are underground networks of pipes and tunnels built to manage stormwater and wastewater in communities. Many sewer systems in the Calumet Region were built over a century ago and designed to accommodate recorded rainfall levels at time of development. Today, these aging and often undermaintained sewer systems are overwhelmed by increased precipitation and may experience failure in the form of collapsed or cracked pipes or clogs in the system that prevent proper flow of sewage and stormwater.
There are typically two types of municipal sewer systems: Combined Sewer Systems (CSS) and Municipal Separate Storm Sewer Systems (MS4), communities may be serviced by either one or both. Combined sewer systems collect stormwater runoff, industrial wastewater, and domestic sewage into the same pipe3. This combination of storm and wastewater travels through a system of pipes and tunnels to a sewage treatment plant which filters and discharges the treated wastewater (or effluent) into a water body. Municipal Separate Storm Sewer Systems have two separate pipes for stormwater and for wastewater. Stormwater is discharged directly into the receiving water body, while the wastewater travels to a treatment plant and is discharged into a waterway after it’s filtered and treated.
Areas with CSS tend to have a higher risk of flooding because most CSS cannot accommodate the volume of water entering the system during moderate or heavy rain events. The combination of stormwater and sewage entering pipes and tunnels that cannot accommodate it results in street and yard flooding, and basement backups. CSS also experience combined sewer overflows (CSOs), which is when untreated water containing stormwater, human and industrial waste, debris, and other toxic substances flows directly into local waterways. The US EPA regulates these overflow points and requires that communities have a plan to reduce the frequency of them and address the resulting water quality concerns.
Communities with MS4 systems, while less likely to experience the intensity of flooding driven by CSS, are not immune to flood risk. Older MS4 systems with cracked and under-capacity pipes may cause stormwater to enter the wastewater line and vice versa, causing cross-contamination and possible basement backups and volume capacity issues.
Calumet Park has a combined sewer system.
« Depressed LandSummary: Why it Floods »
3 US EPA, Region. 1. (2022, March 29). What are Combined Sewer Overflows (CSOs)? [Overviews & Factsheets]. US Environmental Protection Agency. www3.epa.gov/region1/eco/uep/cso.html
Recapping Why it Floods
Data limitations prevent knowing precisely why Calumet Park experiences flooding.
The combination of high levels of impermeable land cover and land use types, low levels of permeable land like tree cover, flat land and depression areas, and sewer system type provides initial insights as to why a community experiences flooding. However, more detailed data on the state of the sewer infrastructure (age and capacity), data on housing, and community-level climate change information would provide a more precise explanation for community flooding. These are not included because detailed data on the sewer infrastructure is rarely available publicly and CNT’s tool is intentionally designed to look at data at the neighborhood level. Housing-specific data, like home age, is most informative when analyzed at the individual household scale. Climate change data are most readily available at a regional scale – e.g., future rainfall projections are generally provided for the State of Illinois or the Great Lakes region, a scale much too large to visualize in this mapping tool.
Calumet Park should consider the factors contributing to flooding and where residents experience flooding when developing stormwater management plans.
You now have a better understanding of where and why it might flood in Calumet Park. Continue to the third and final chapter “Who is impacted?” to explore the data that help inform who bears the brunt of urban flooding.
Who is impacted?
Mapping flooding impacts in Calumet Park
Urban flooding can affect anyone living in an urban area— either in their homes or in public areas. But not all homes, blocks, or communities are impacted equally. While local flood data for the Calumet region shows widespread flooding impacts, we know urban flooding in Chicago disproportionately impacts lower-income residents and people of color.4
As in the previous chapters you explored to understand where and why it floods in Calumet Park, the following maps and data begin to tell the story of who flooding impacts and where other existing environmental burdens exist, furthering flooding concerns.
« Summary: Why it FloodsConsequences and Inequalities »
4 Center for Neighborhood Technology. (2019). Flooding in Chicago: An Unequal Burden. Center for Neighborhood Technology.https://www.cnt.org/sites/default/files/pdf/FloodEquity2019.pdf
www.cnt.org/sites/default/files/pdf/FloodEquity2019.pdf
Consequences and Inequities
The consequences of flooding further burden residents, especially those with existing demographic inequities, and their environment.
Negative flooding consequences faced by Calumet Park residents are best understood alongside existing quality of life challenges. Given the impact of racism, classism, and segregation on communities and the surrounding environments, the data looks at community demographics like race and income, as well as existing environmental sensitivities, like air and water quality concerns. Existing environmental sensitivities are included to portray a more realistic outlook on a community’s array of environmental burdens.
Marginalized populations like those with disabilities or low incomes can experience negative flooding impacts more intensely, especially coupled with hazardous air and contaminated water, due to limited mobility access or adequate financial resources for recovery. Additionally, people hold multiple identities at the same time, and the intersection of these identities affects how people experience flooding impacts.
To better understand who may face worse flooding impacts due to existing demographic inequities, CNT uses demographic data gathered from the U.S. Census Bureau’s American Community Survey. Specifically, we look at
- race and ethnicity,
- low-income households,
- linguistically isolated households with limited English-speaking residents,
- residents with no health insurance, and
- residents with a disability.
The following map layers serve as an introduction to sensitive communities. There are other vulnerable populations to consider, which need to be determined in conversation with residents.
These maps only show where people with these demographic identities live. It does not describe all the ways they are negatively impacted by flooding.
The maps you have just reviewed only show where people with these demographic identities live; it does not describe all the ways they are negatively impacted by flooding. People hold multiple identities at the same time, and the intersection of these identities means that how people experience flooding is highly individual. For example, a person who is low-income, Black, and disabled will feel the burden of flooding differently from someone who is high-income, Black, and disabled. This intersectional identity might result in these residents experiencing worse flooding impacts compared to those who are more financially stable, able-bodied, English-speaking, and/or white.
Environmental Sensitivities
Many households and neighborhoods harmed by urban flooding may already experience or be more susceptible to other environmental issues, like polluted air and water. CNT maps local air quality to show particulate matter (PM 2.5) and ozone levels along with water quality to show wastewater discharge.
Who Is Impacted
Environmental Sensitivities
Air quality through PM 2.5 and Ozone
In the short-term, PM 2.5 and ozone irritate the eyes, throat, and lungs and can worsen asthma. Long-term exposure to these pollutants can increase one’s risk of heart and lung disease and may cause premature death especially for those with preexisting health conditions.
Air quality through PM 2.5
Particulate matter (PM) refers to particles found in the air. PM 2.5 refers to a particle size less than 2.5 micrometers in width, which is about 30 times smaller than the width of a human hair. It’s emitted from activities ranging from cooking to diesel truck driving. PM 2.5 can travel deep into the lungs and cause serious illness over time.
We map PM 2.5 by capturing how many days the pollutant is over 12 micro-grams per cubic meter of air (or 12 ug/m3), the amount at which the U.S. Environmental Protection Agency (EPA) standard begins. Any amount higher is dangerous.
Air quality through Ozone
Ozone, a gas toxic to humans, is vital to keeping us safe from the sun’s harmful rays but only when it’s in the upper atmosphere. However, ozone can be found at the ground-level as a byproduct of industrial activity, traffic pollution, and other sources that people can inhale. Exposure to ozone at ground level can make it more difficult for people to breathe because it damages the lungs and airways in the body.
We map ozone by capturing how many days ozone levels are over 50 parts per billion (or 50 ppb). This means 50 units of ozone within 1 billion units of air.
The U.S. National Ambient Air Quality Standards (NAAQS) determined that ground-level ozone should be 70 ppb or less because more than that can harm “healthy exercising adults.”5 50 ppb of ozone may harm vulnerable populations like asthmatic children.6
« Environmental SensitivitiesSummary: Who is Impacted »
5 US EPA. (2015). Overview of EPA’s updates to the Air Quality Standards for Ground-Level Ozone. US Environmental Protection Agency.
https://www.epa.gov/sites/default/files/2015-10/documents/overview_of_2015_rule.pdf
6 Rosenthal, J. (2007, June 5). What is a Safe Level of Ozone for an Air Cleaner? Tex-Air Filters.
https://www.texairfilters.com/what-is-a-safe-level-of-ozone-for-an-air-cleaner/
Recapping Who is Impacted
Flooding is a widespread issue throughout the Calumet Region. However, it becomes especially problematic when it occurs to vulnerable communities.
Demographics like someone’s race and income can affect an individual’s flooding experience, especially if they are a Black or Brown or another person of color, low-income, uninsured, do not primarily speak English, and/or have a disability.
These vulnerable communities may be financially insecure or burdened with impacts from past emergencies or crises. This may make it more difficult to prepare for and bounce back from severe storm events that result in flooding. Along with financial hardship, flooding— one-time or recurring— can exacerbate physical and mental health and lessen their quality of life.
Flooding can feel even more distressing when it is one of many environmental stressors present.
This layering of vulnerabilities – demographic inequities, like race, income, and disability; environmental stressors, like water and air pollution; and severe flooding can create adverse and long-lasting cumulative impacts for some in the Calumet Region.
To best understand the impacts of flooding on a specific population, community conversations must be held with a representative sample of residents to ensure a holistic picture of who is impacted and their concerns.
It is important to note that the listed demographics are likely not representative of all those who are most burdened by flooding. To best understand the impacts of flooding on a specific population, community conversations must be held with a representative sample of community residents to make sure that a holistic picture of who is impacted and their concerns are comprehensively collected. Similarly, there are other environmental issues affecting communities that have not been presented or for which data may not yet be available. Flooding awareness advocates can partner with other environmental and community advocates to learn about the multiple burdens that the community might be facing.
The Baseline in Urban Flooding Baseline
All the flood data and maps presented and analyzed by CNT’s Urban Flooding Baseline tool paint a clear picture: communities in the Calumet Region experience flooding.
However, the information provided through this resource is only meant to give an introductory overview of where it floods, why it floods, who is most impacted, and the sensitivities coexisting with flooding in the Calumet Region between 2010-2020.
From Flood Education to Action
It’s important for community leaders and government decision-makers to partner with residents to develop resources so that the most vulnerable within a community can readily access them, and thus strengthen the community’s resilience.
Head over to the Community Advocacy or Homeowner Guidance resources pages for some ideas.