Map of
Satellite View
Street View
Not sure what some of these data layers mean?
Click Here to view guided analysis for .
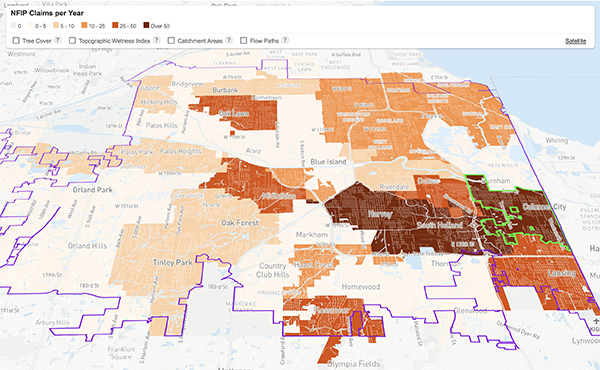
Where is it flooding?
Flood Insurance Claims
National Flood Insurance Program
Private Insurance
Disaster Relief
Problem Areas
Identified through Community Meetings
Identified by Municipalities
Identified through Surveys
Note: Problem area data was collected only for the 2016 RainReady Calumet Corridor Plan in Blue Island, Calumet City, Calumet Park, Dolton, Riverdale, and Robbins.
Risk-based flood maps:
National Hazard Flood Plains
FloodFactorTM at Risk Properties
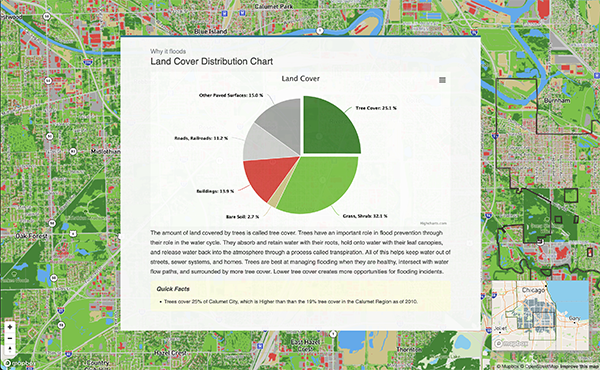
Why is it flooding?
Impermeable & Permeable Surfaces
Land Cover
Land Use
Building Footprints
Tree Cover
Water Movement:
Topographic Wetness Index
Catchment Areas
Flowpaths
Who is impacted?
Demographic data (Census):
People of Color
Low Income Households
Linguistic Isolation
Population Age Under 5
Population Age Over 64
Population with a Disability
Renter Households
Population without Health Insurance
Residents without a Car
Demographic Index
Existing community vulnerabilities:
Number of Days PM 2.5 over 12 μg/m3
Number of Days Ozone over 50 ppb
Wastewater Discharge Indicator
Methodology
The quantitative methods document provides a detailed listing of the indicators showcased in the Maps and Analysis section of the website. The documentation includes information on the source, geographic scale, and vintage of the data.
Download Quantitative MethodologySatellite View of
Click the "Data Layers" menu to explore further.